.png)
The Minor League Skills
That Actually Matter
Everybody knows that good minor league stats don’t guarantee MLB success. But which underlying skills give a hitter the best chance? We stripped out all outcome statistics — no wRC+, no OPS, no batting average — and asked: using only input skills, the process behind the results, what predicts who makes it?
We analyzed every position player who debuted in MLB between 2015 and 2025 — 1,159 hitters — tracking their minor league skill profiles across 23 input metrics sourced from FanGraphs and the MLB Stats API. Then we built models to identify which skills, and which combinations of skills, historically separate future stars from future busts.
The findings have direct implications for how teams should evaluate prospects, how player development staffs should set targets, and which players on the 2026 FanGraphs prospect board have the profiles that historically produce at the highest rates.
The Skill That Survives the Jump
Before asking what predicts success, we first need to know: do minor league skills even hold at the major league level?
The answer varies dramatically by skill:
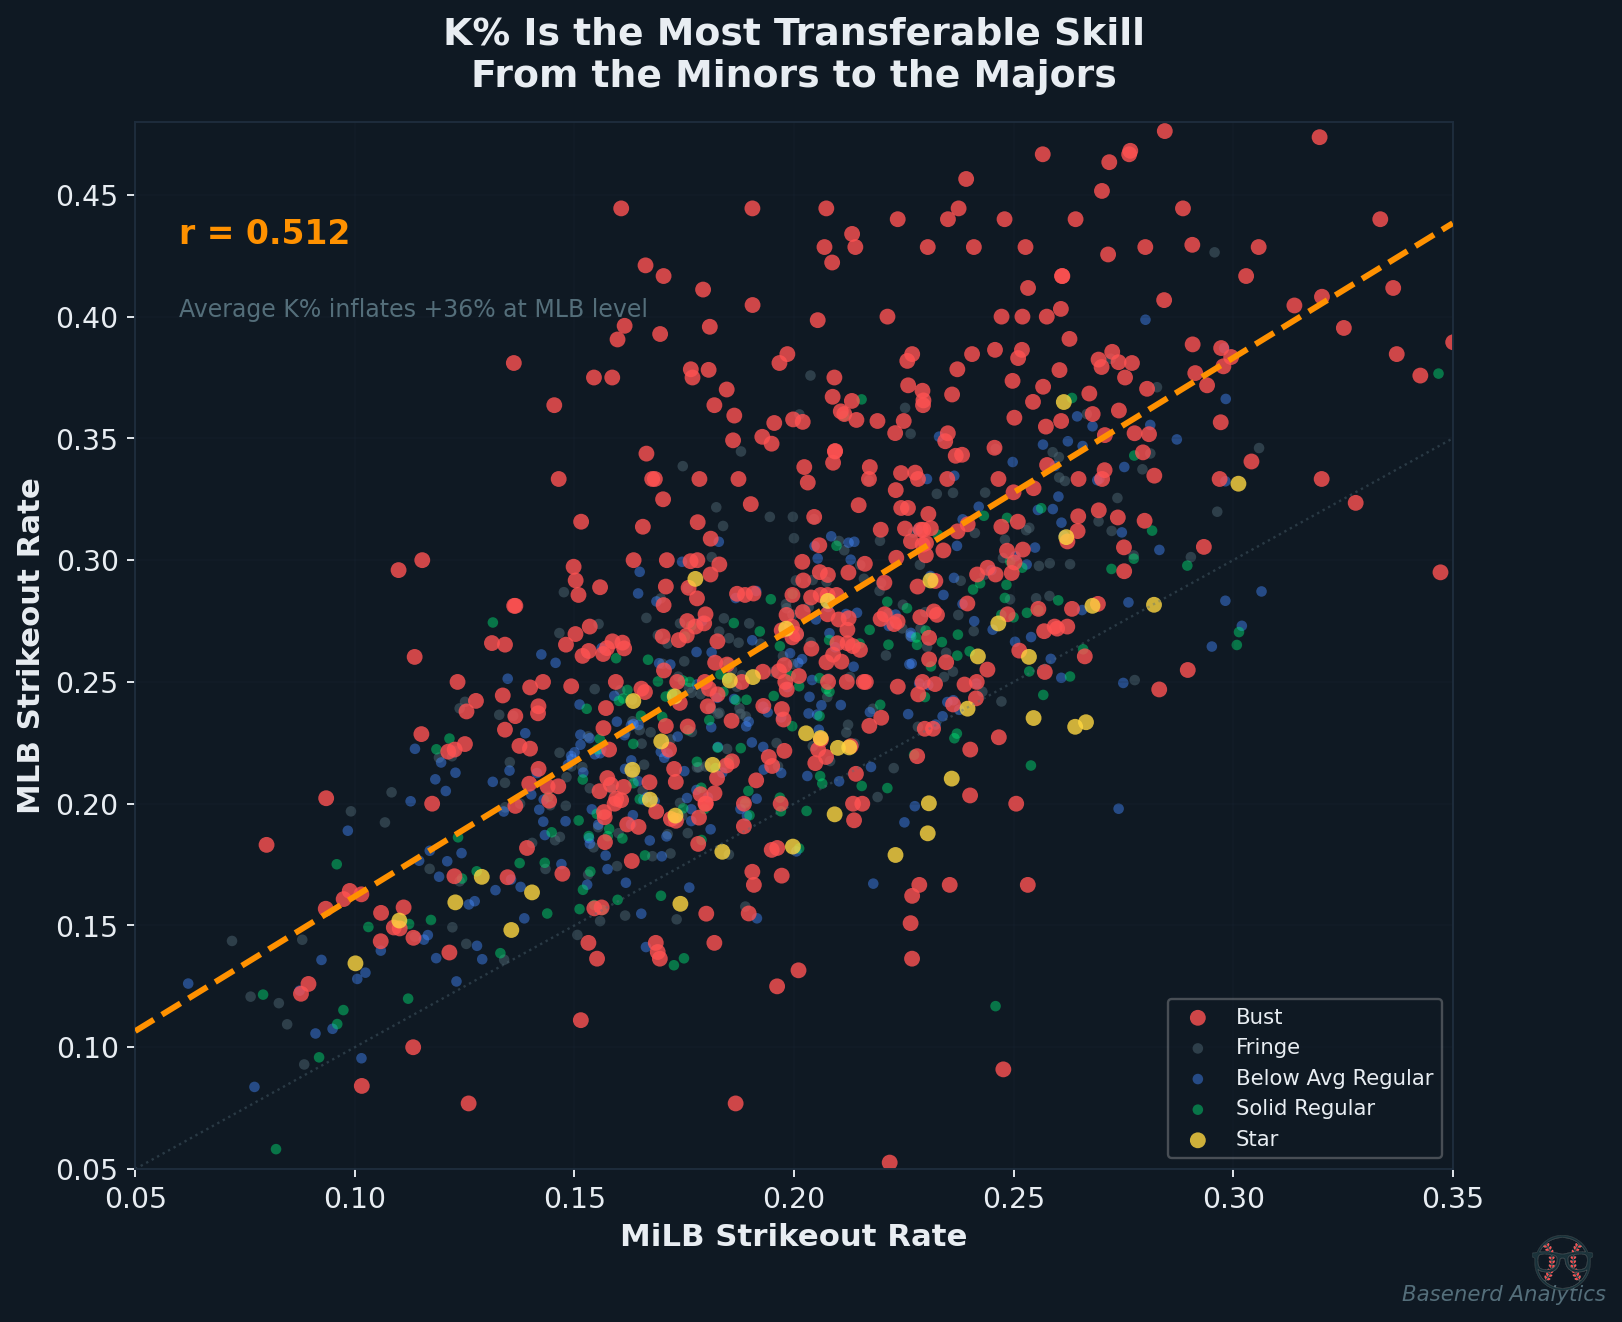
- K% transfers the best (r=0.512). A hitter’s MiLB strikeout rate is the single best predictor of their MLB strikeout rate.
- ISO transfers moderately (r=0.402). Power shows up at the next level, but it degrades.
- Walk rate only partially holds (r=0.347). MiLB walks are a weaker signal than most people assume.
The level jump is brutal across the board. Strikeouts go up 36%, power drops 22%, walks drop 22%. Every hitter gets worse. The question is which skills degrade the least — and that’s where K% stands out.
A hitter striking out 20% of the time in AAA should expect roughly 27% in the majors. Plan accordingly.
Ranking Every Input Skill
We trained a Random Forest model using only input/process metrics — no outcomes — and measured each skill’s importance via permutation testing.
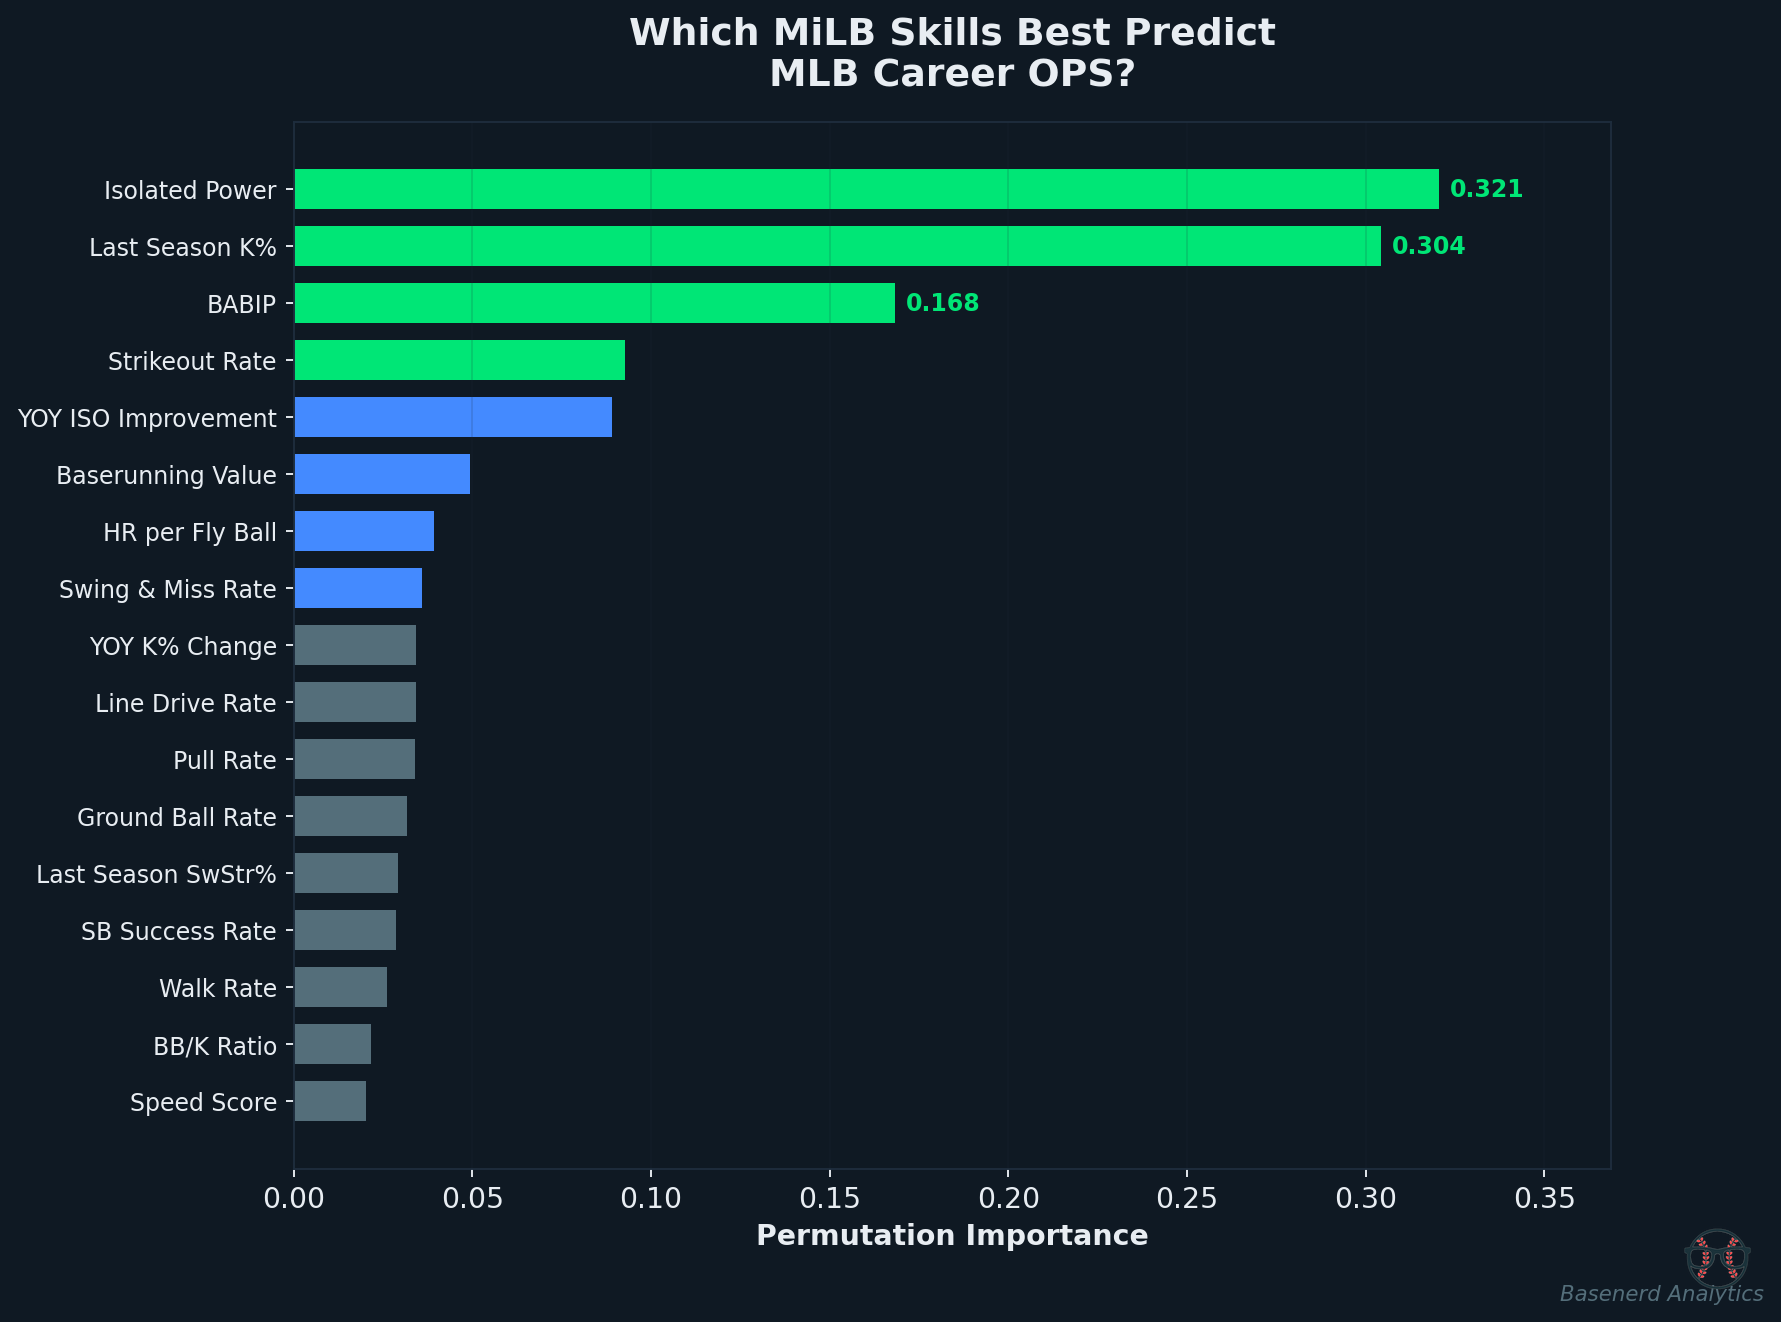
The headline: ISO and K% tower above everything else. Together they account for more predictive signal than every other skill combined. BABIP ranks third, suggesting that contact quality (not just contact quantity) matters.
One of the most surprising findings: walk rate (BB%) is nearly useless as a standalone predictor of MLB career OPS. A hitter who walks a lot in the minors is not meaningfully more likely to have a good MLB career. However, BB/K ratio — which captures both patience AND the ability to make contact — does carry signal. It’s the combination that matters.
When we train a model specifically to distinguish future MLB stars from busts, speed and athleticism metrics (Speed Score, wBsR, SB success rate) become much more important, suggesting that overall athleticism acts as a safety net. Athletic players find ways to contribute even when their primary skills are challenged by MLB pitching.
The K% Cliff and the ISO Floor
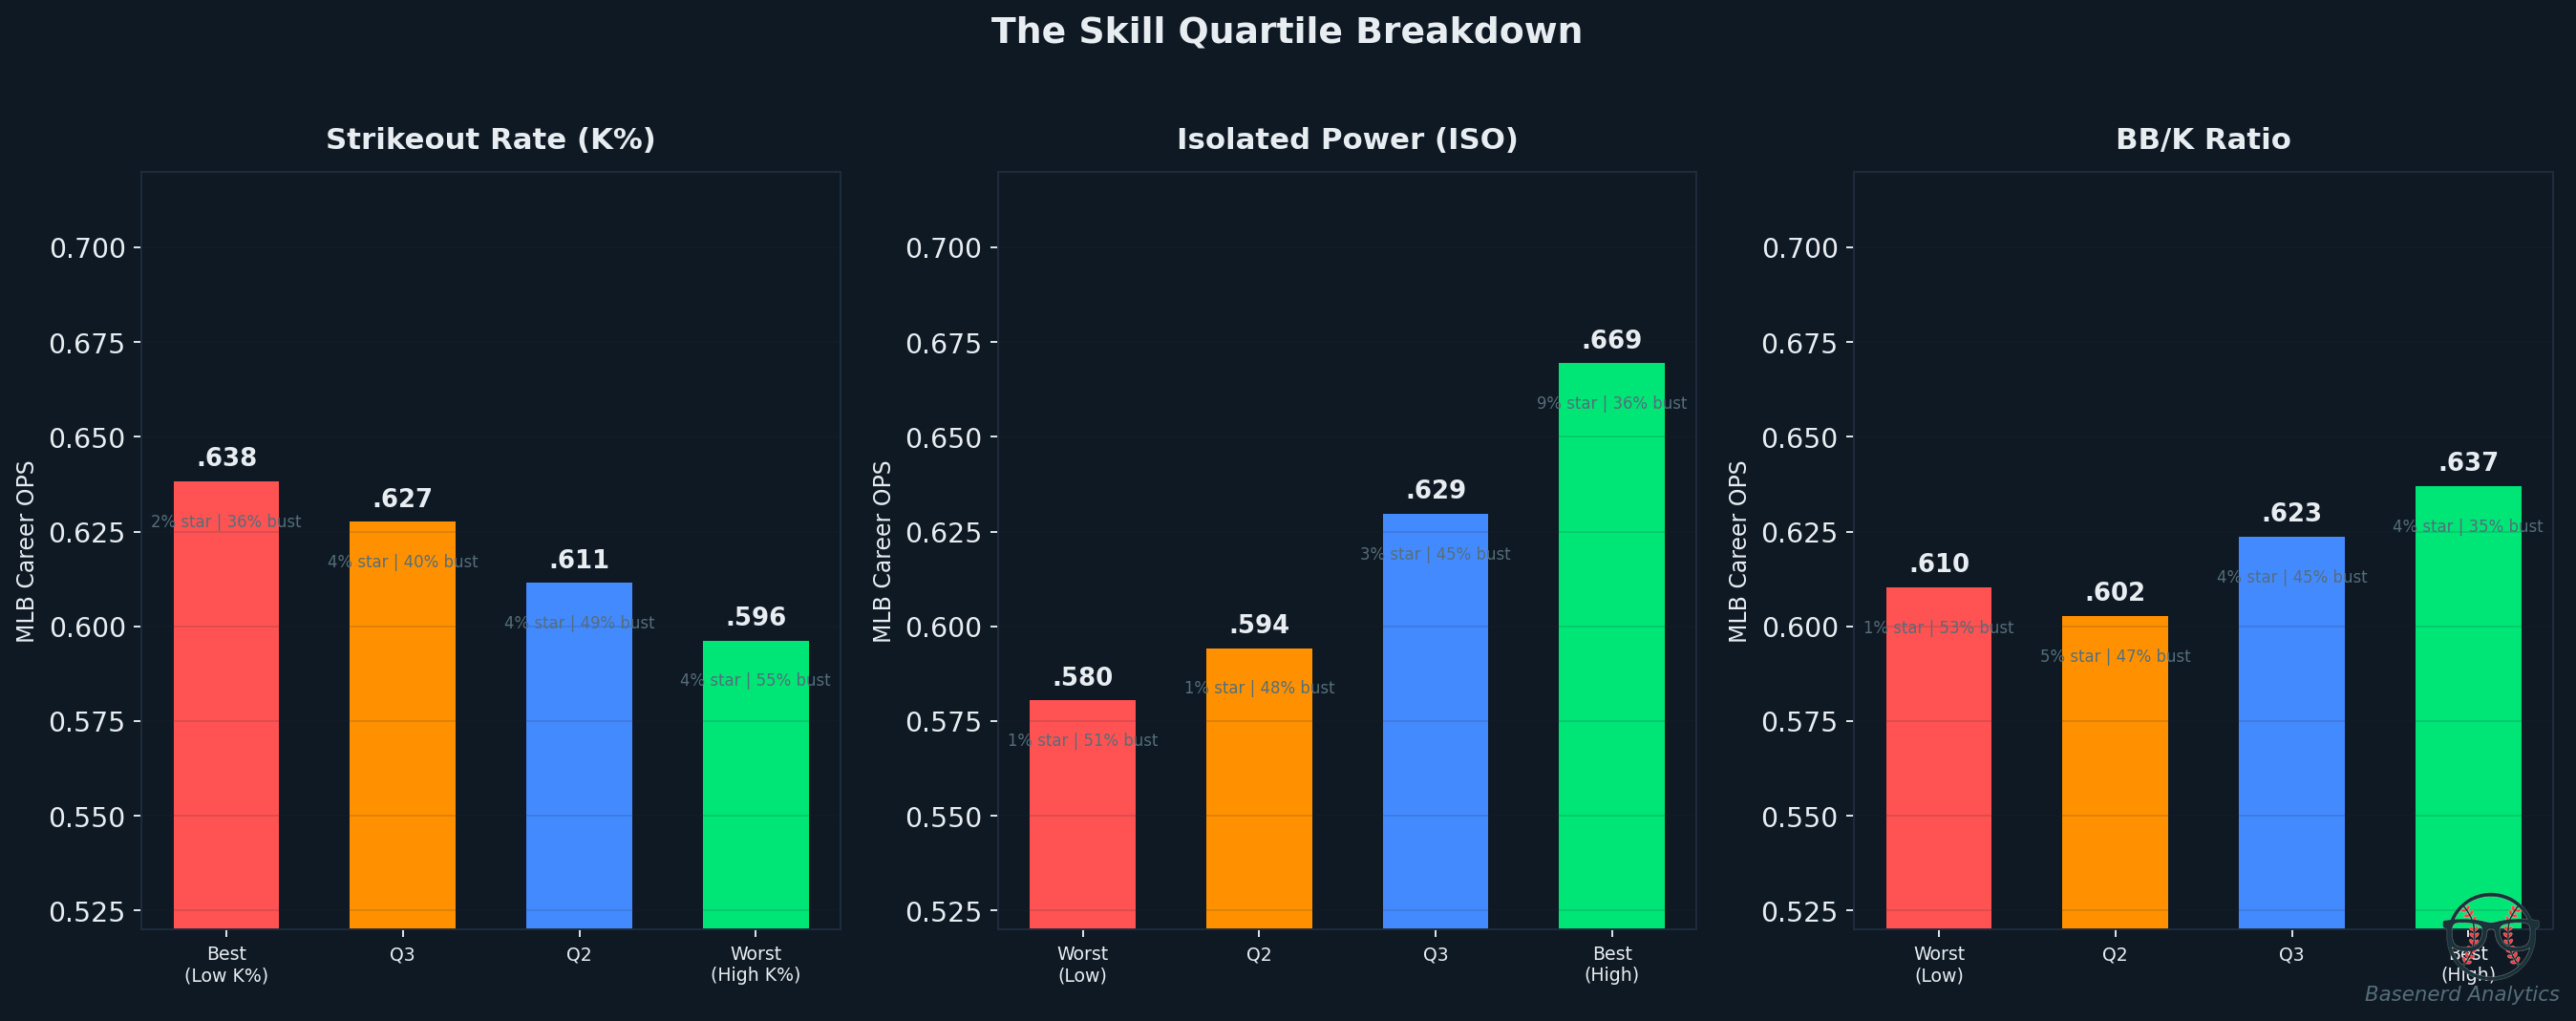
Breaking each skill into quartiles reveals where the critical thresholds are.
The K% Cliff
Low-K% hitters (bottom quartile, ~13.5% average) accumulate nearly twice as many career plate appearances as the highest-K% quartile (1,195 vs 667 PA). They don’t necessarily produce stars at a higher rate, but they almost never bust out — 36% bust rate vs 55%. Strikeout avoidance doesn’t guarantee stardom, but it buys you a career.
The ISO Floor
Bottom-quartile ISO (.101) hitters have a 51% bust rate and only a 1.4% star rate. Without power, there is almost no path to MLB stardom. The top ISO quartile (.220) flips the script: 9% star rate, 36% bust rate.
BB/K Ratio: The Best Single Discipline Metric
BB/K ratio captures discipline more effectively than BB% or K% alone. Top-quartile BB/K hitters have the lowest bust rate (34.8%) of any single-skill split and accumulate 60% more career PA than bottom-quartile BB/K hitters.
It’s Not One Skill — It’s the Combination
This is the core finding, and the most actionable part of the entire analysis. Individual skills tell you something. Skill combinations tell you everything.
The Elite Profile: Discipline + Power
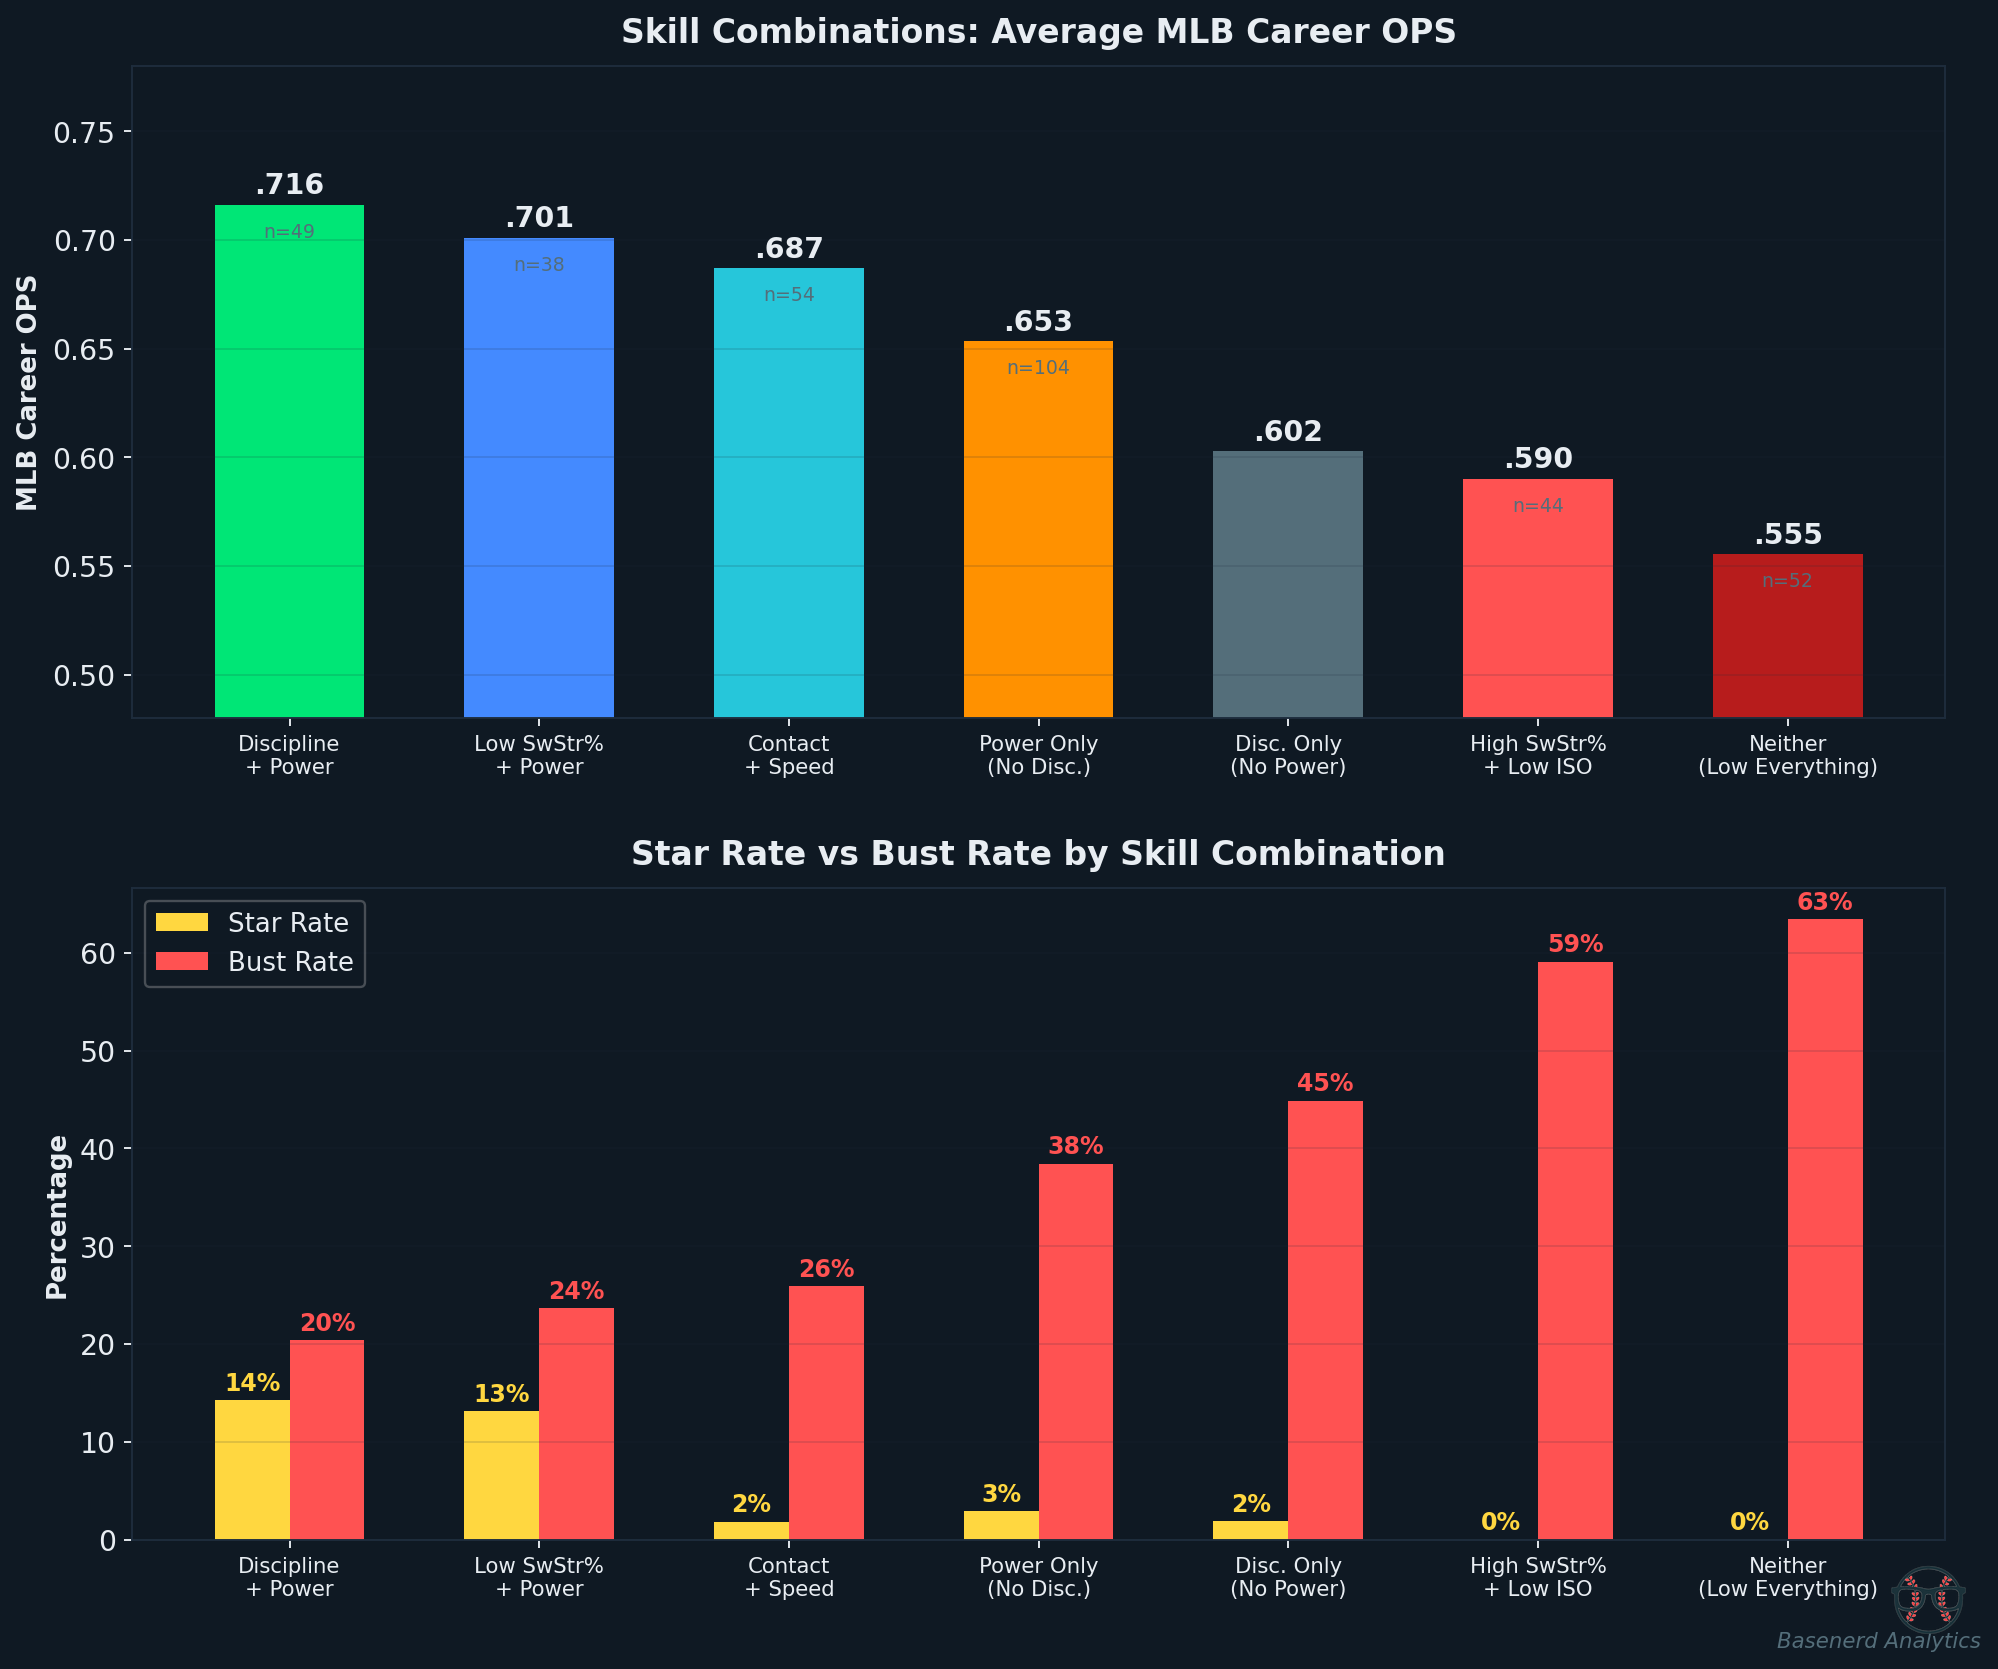
Hitters with top-quartile BB/K AND top-quartile ISO: .716 career OPS, 14.3% star rate, 20.4% bust rate. The names tell the story: Juan Soto, Yordan Alvarez, Vladimir Guerrero Jr., Matt Olson, Pete Alonso.
The Death Sentence: Low BB/K + Low ISO
Hitters with bottom-quartile discipline AND bottom-quartile power: .555 career OPS, 0% star rate, 63.5% bust rate. Not a single hitter out of 52 with this profile became a star. Not one.
High SwStr% + Low ISO: Another Zero
Of the 44 hitters with top-quartile swing-and-miss AND bottom-quartile power, zero became stars. The bust rate was 59%. If a hitter swings and misses a lot AND doesn’t have power, there is historically no path to MLB success.
The key insight for player evaluation: power without discipline still produces some stars (2.9%), but discipline without power almost never does (1.9%). However, discipline dramatically lowers the floor — disciplined hitters bust at a much lower rate regardless of power.
Discipline sets the floor. Power sets the ceiling. You need both.
Who Hits the Ground Running?
Do certain skill profiles predict which hitters will produce immediately upon reaching MLB versus those who need time to adjust?
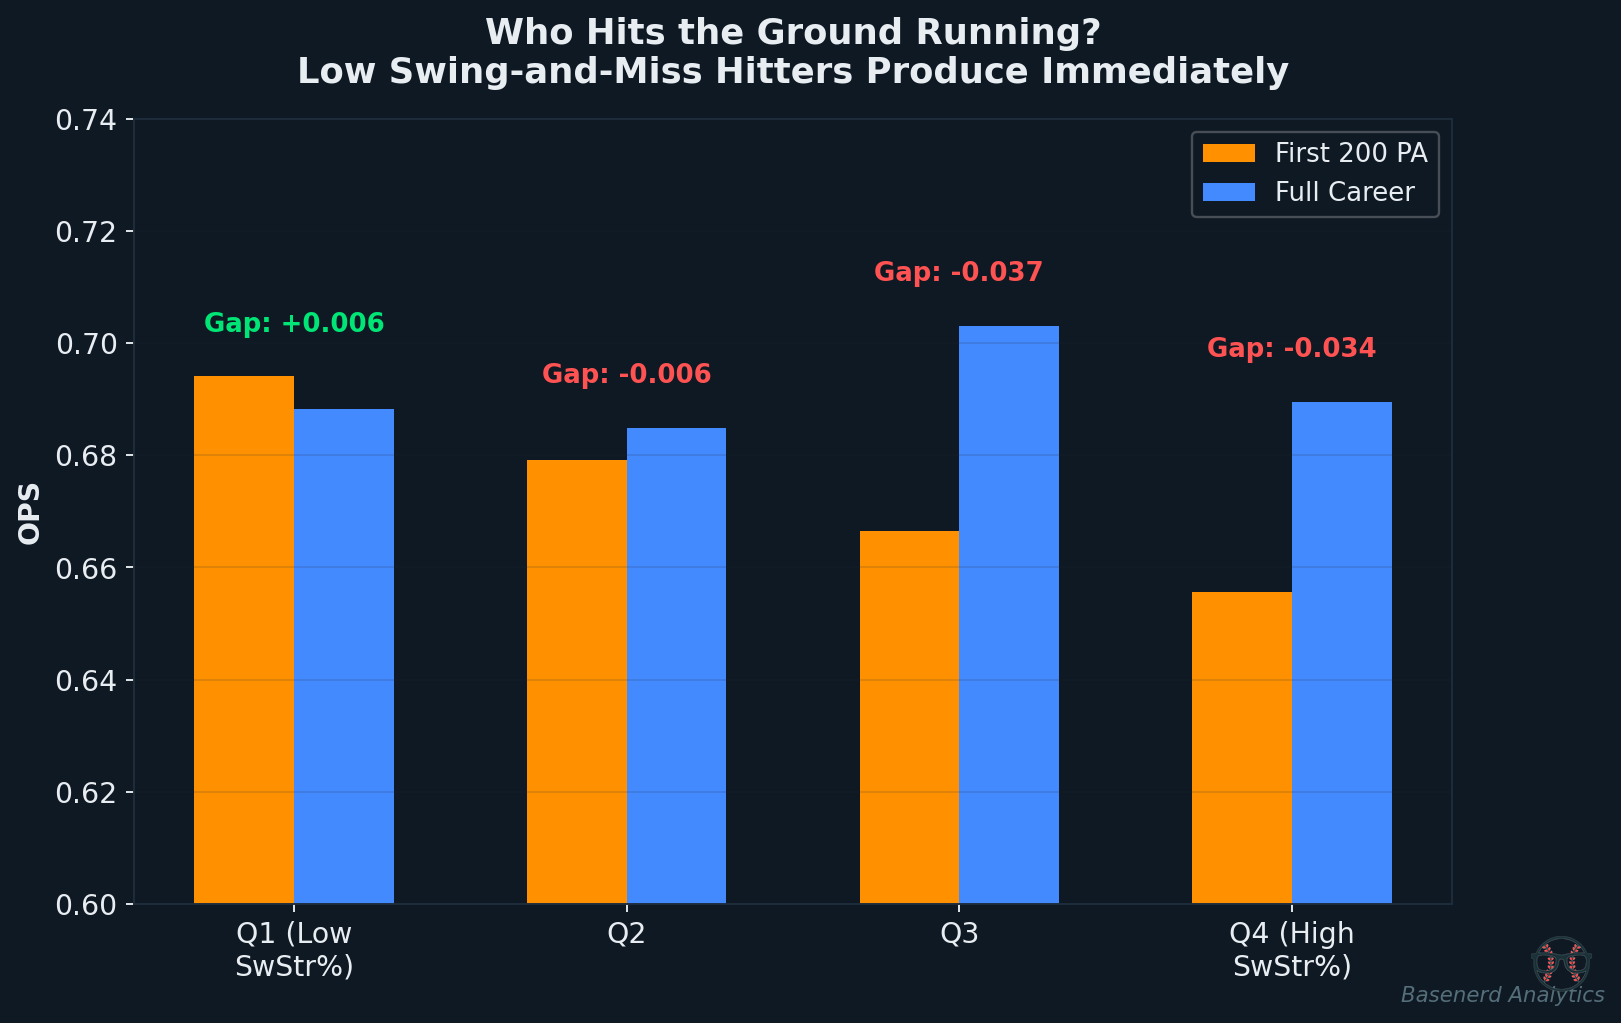
Low swing-and-miss hitters produce immediately. Hitters in the lowest SwStr% quartile have essentially zero adjustment gap (+0.006) — their first 200 PA look like their career numbers. High SwStr% hitters need significant development time (gap of -0.034).
This has direct roster management implications. When calling up a prospect in August for a playoff push, the low-SwStr%, high-BB/K prospect will contribute from day one. The high-ISO, high-SwStr% prospect may take half a season to find his footing — but could ultimately have a higher ceiling.
The Prospect Map: Case Studies
Here’s every hitter who debuted in MLB between 2015-2025, plotted by their MiLB K% and ISO. Gold stars mark future MLB stars; red X’s mark busts.
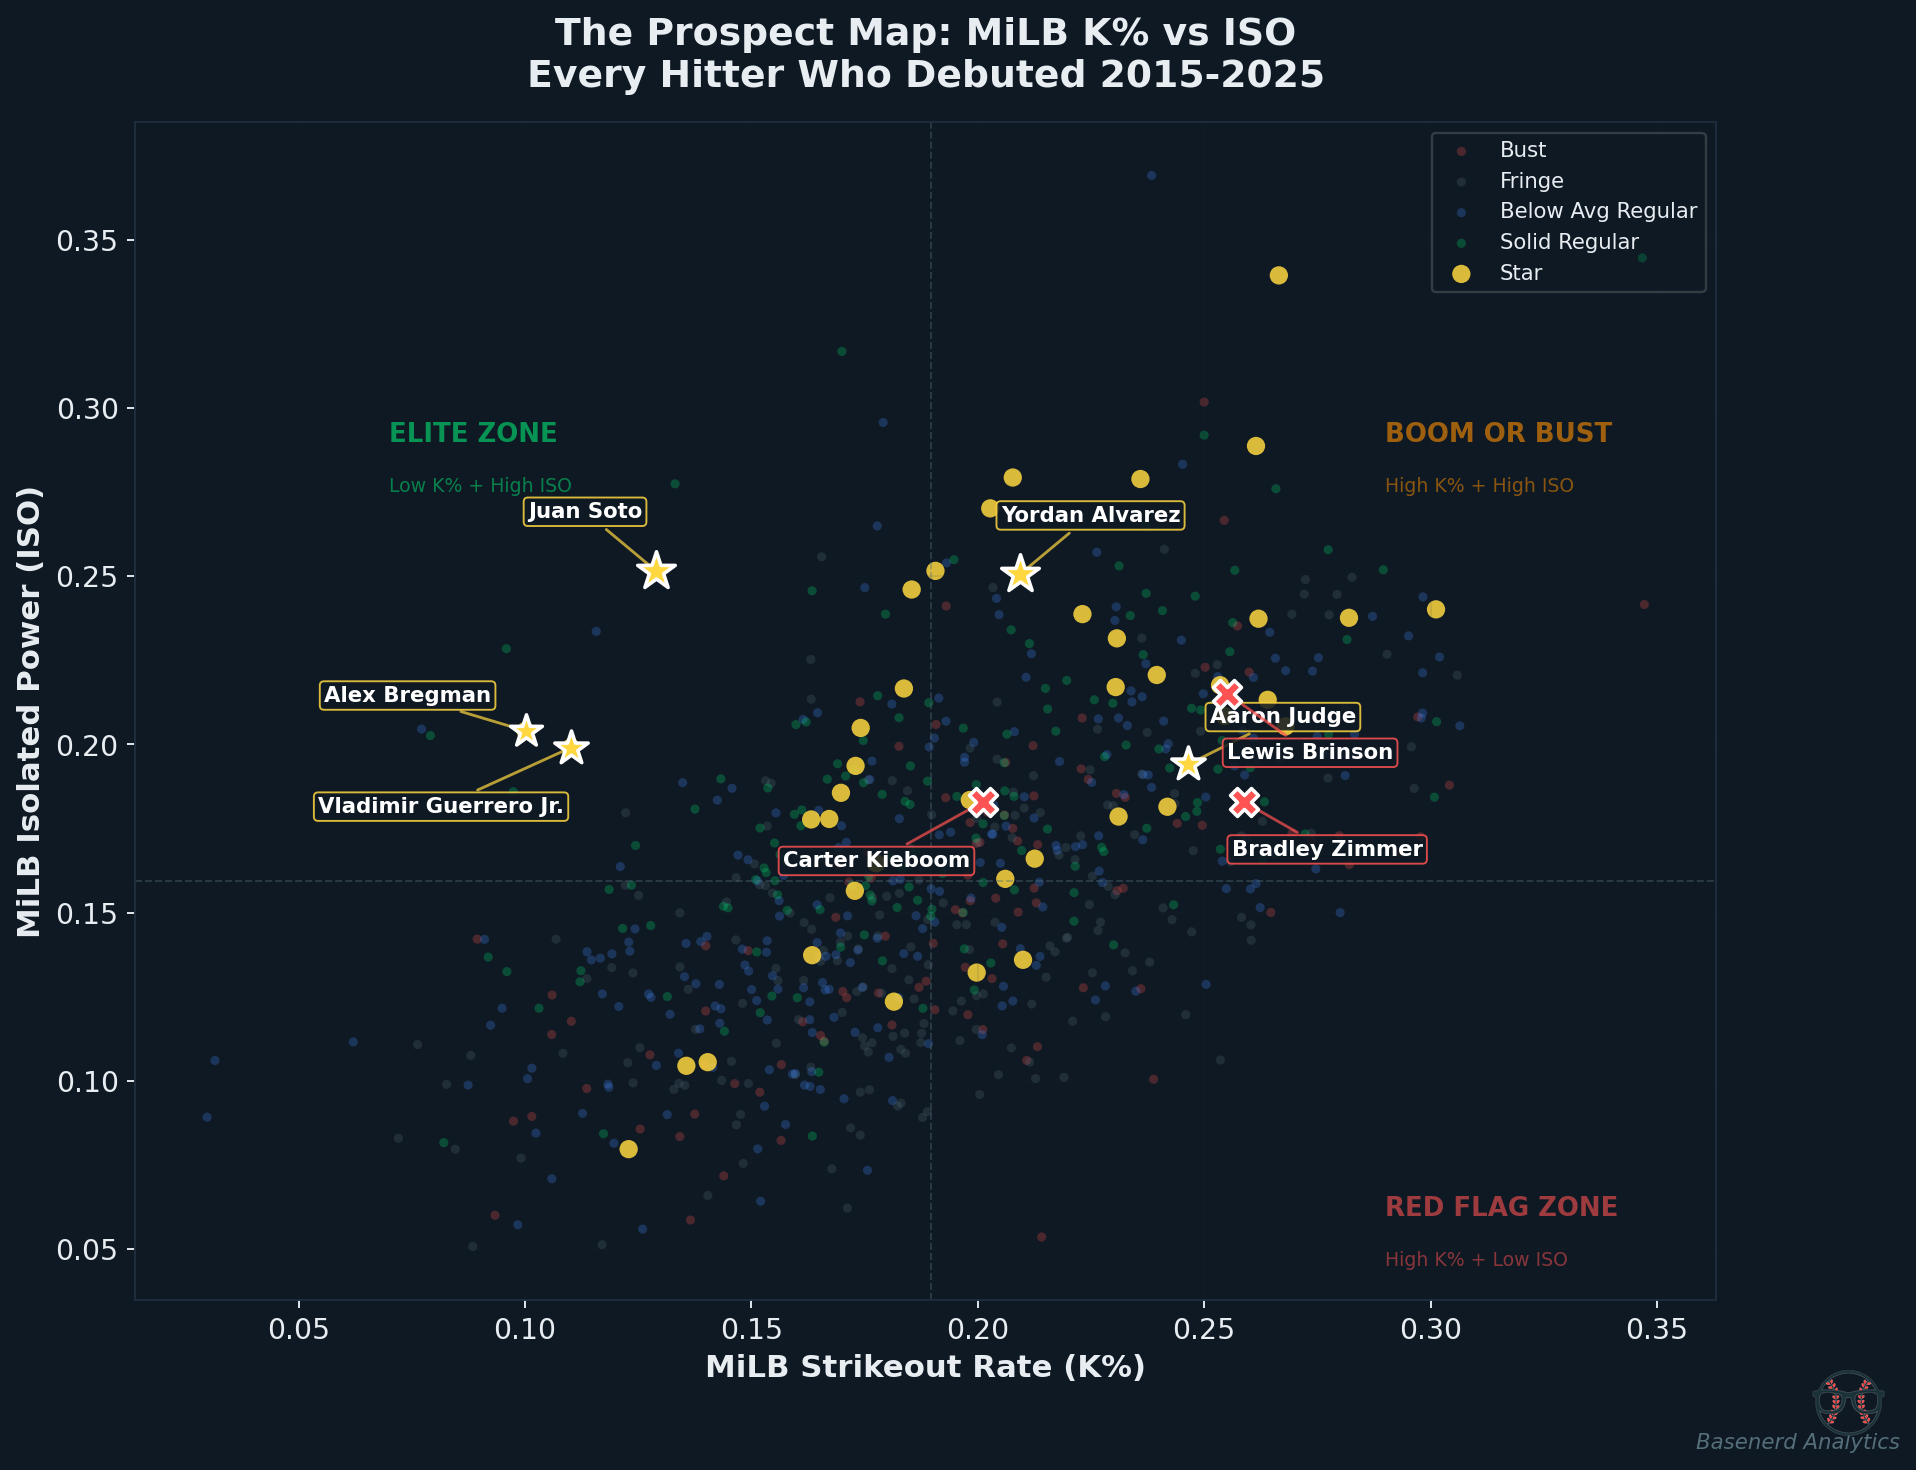
Stars Our Model Would Have Predicted
| Player | MiLB BB% | MiLB K% | MiLB ISO | MiLB SwStr% | MLB OPS |
|---|---|---|---|---|---|
| Juan Soto | 11.3% | 12.9% | .252 | 10.4% | .937 |
| Yordan Alvarez | 12.4% | 20.9% | .250 | 9.3% | .967 |
| Vladimir Guerrero Jr. | 12.0% | 11.0% | .199 | 10.6% | .861 |
| Aaron Judge | 12.5% | 24.7% | .194 | 13.1% | 1.025 |
| Alex Bregman | 11.2% | 10.0% | .204 | 7.3% | .843 |
| Pete Alonso | 10.5% | 20.3% | .270 | 9.2% | .852 |
| Kyle Tucker | 9.2% | 17.4% | .205 | 12.7% | .862 |
Every star on this list had the “Discipline + Power” or “Low SwStr% + Power” profile in the minors. Juan Soto’s minor league profile is almost unrealistically good: 11.3% BB, 12.9% K, .252 ISO — elite discipline AND elite power at 18-19 years old.
Busts Our Model Would Have Flagged
| Player | MiLB BB% | MiLB K% | MiLB ISO | MiLB SwStr% | MLB OPS |
|---|---|---|---|---|---|
| Lewis Brinson | 8.4% | 25.5% | .215 | 23.2% | .574 |
| Carter Kieboom | 11.6% | 20.1% | .183 | 11.5% | .597 |
| Bradley Zimmer | 11.4% | 25.9% | .183 | 15.5% | .610 |
| AJ Reed | 12.3% | 20.2% | .261 | 15.2% | .475 |
| Henry Davis | 13.1% | 20.3% | .247 | 10.2% | .561 |
Lewis Brinson is the classic cautionary tale: top prospect with explosive tools but a 25.5% MiLB K rate and a 23.2% SwStr% — the highest in our bust group by far. Our model would have flagged the elevated swing-and-miss as a major risk factor, even as his raw power looked enticing.
Evaluating the 2026 Prospect Board
We applied this framework to every hitter on the current FanGraphs 2026 prospect board. Here’s how the ranked hitters stack up.
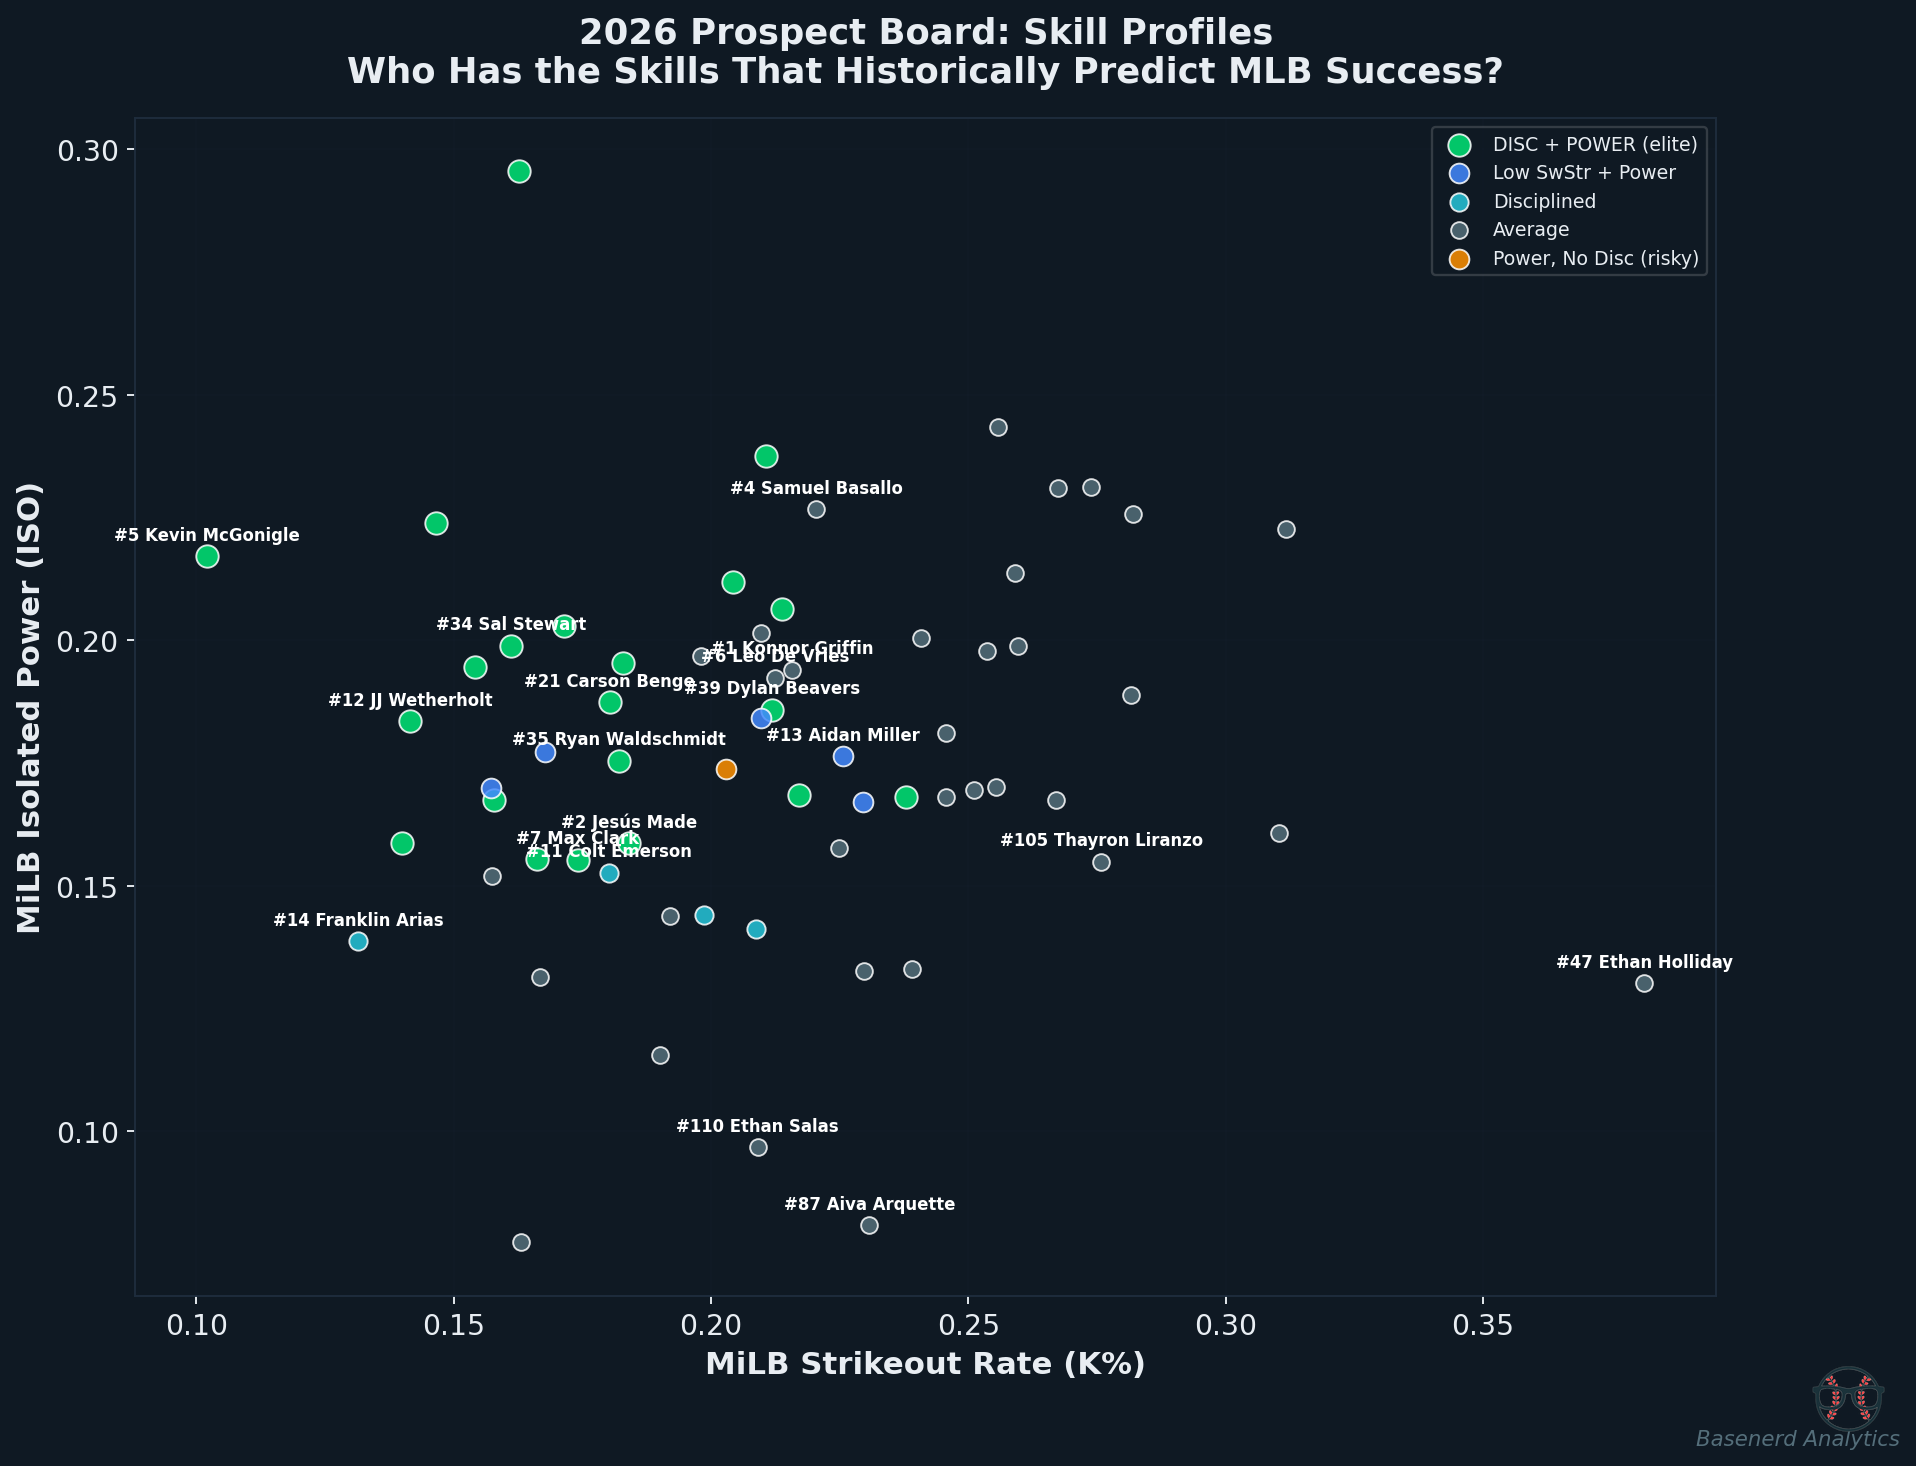
The Model’s Favorite: Kevin McGonigle
#5 overall, DET — Composite Score: 0.874 (highest on the board)
A 20-year-old at A-AA with a 10.2% K rate, .217 ISO, and 6.3% SwStr%. This is the “Discipline + Power” profile that historically produces a 14.3% star rate. His contact ability at his age is extraordinary — only a handful of players in our 1,159-player dataset had a K% this low with ISO this high. FanGraphs already has him at #5 overall with a FV of 60, but the underlying skill inputs say he deserves even more attention.
Other Top Skill Profiles
| Rank | Name | FV | Comp. | BB% | K% | ISO | SwStr% | Skill Combo |
|---|---|---|---|---|---|---|---|---|
| #5 | Kevin McGonigle | 60 | 0.87 | .145 | .102 | .217 | .063 | Disc + Power |
| #12 | JJ Wetherholt | 55 | 0.85 | .141 | .141 | .183 | .077 | Disc + Power |
| #21 | Carson Benge | 55 | 0.85 | .134 | .180 | .187 | .080 | Disc + Power |
| #34 | Sal Stewart | 50 | 0.81 | .115 | .161 | .199 | .089 | Disc + Power |
| #35 | Ryan Waldschmidt | 50 | 0.81 | .166 | .182 | .175 | .086 | Disc + Power |
| #7 | Max Clark | 60 | 0.80 | .152 | .174 | .155 | .074 | Disc + Power |
| #39 | Dylan Beavers | 50 | 0.80 | .143 | .212 | .186 | .085 | Disc + Power |
JJ Wetherholt is the profile that pitching coaches and player development people dream about: 14.1% BB, 14.1% K — perfect symmetry between walks and strikeouts. Disc + Power at AA-AAA at 22 years old.
Sal Stewart and Ryan Waldschmidt both rank outside the top 30 but have skill profiles that historically produce at the highest rates. These are the “undervalued by ranking, validated by skills” guys.
Prospects Whose Skills Lag Their Ranking
Not every highly-ranked prospect has a skill profile that matches their pedigree.
| Rank | Name | FV | Comp. | K% | SwStr% | ISO | Flag |
|---|---|---|---|---|---|---|---|
| #47 | Ethan Holliday | 50 | 0.35 | .381 | .164 | .130 | 38% K rate in A-ball |
| #16 | Bryce Eldridge | 55 | 0.56 | .274 | .146 | .231 | High K% projects to ~37% in MLB |
| #4 | Samuel Basallo | 65 | 0.61 | .220 | .137 | .227 | 13.7% SwStr% for a FV 65 |
| #28 | Carson Williams | 55 | 0.65 | .312 | .152 | .223 | 31% K rate at AAA |
Ethan Holliday has the worst composite score on the entire ranked board. A 38.1% K rate in A-ball is historically catastrophic — our model says that projects to roughly a 50%+ K rate against MLB pitching. The sample is small (118 PA), but the SwStr% (16.4%) confirms the swing-and-miss is real, not just bad luck.
Bryce Eldridge has legitimate power (.231 ISO at AAA), but his 27.4% K rate and 14.6% SwStr% place him in the “Power, No Discipline” profile that historically produces only a 2.9% star rate. The Spencer Jones comp is uncomfortably close.
What This Means
For Talent Evaluation
- ISO and K% are the two input skills that matter most. Evaluate them together, not in isolation.
- The “Discipline + Power” combination is the highest-signal profile in our data. It has 7x the star rate and 3x lower bust rate than the “Neither” profile.
- BB% alone is nearly useless as a predictor. BB/K ratio — which captures both patience and contact ability — is far more informative.
For Player Development
- K% inflates 36% from MiLB to MLB. A minor leaguer needs to get their K% well below 20% to project as an average MLB hitter.
- ISO drops 22% from MiLB to MLB. A .200 ISO in AAA projects to roughly .156 in the majors.
- Year-over-year ISO improvement is one of the most predictive trajectory metrics. A prospect who is gaining power is more valuable than one with static numbers.
For Roster Management
- Low-SwStr%, high-BB/K prospects produce immediately at the MLB level (zero adjustment gap).
- High-ISO, high-SwStr% prospects need patience — expect 200+ PA of below-career-average production before they adjust.
- For a September callup or playoff roster addition, prioritize the disciplined hitter over the raw power guy.
Methodology
Data: 1,159 position players who debuted in MLB between 2015-2025. Year-by-year stats across all minor league levels from the MLB Stats API. Advanced metrics (SwStr%, batted ball data, spray charts, speed scores) from FanGraphs minor league leaderboards, 2010-2025. 2026 prospect rankings from FanGraphs’ The Board.
Approach: We deliberately exclude outcome statistics (wRC+, OPS, batting average, wOBA) from the predictor set. We also exclude age at debut and minor league seasons played. The model uses only input/process/skill metrics: BB%, K%, SwStr%, BB/K, ISO, HR/FB, LD%, GB%, FB%, IFFB%, BABIP, Pull%, Oppo%, Speed, baserunning value, and year-over-year skill changes.
Model performance: The input-skills-only Random Forest achieves R-squared of 0.052 for predicting MLB career OPS, and AUC of 0.785 for classifying stars vs busts. Skills alone explain ~5% of career OPS variance — the rest is injuries, opportunity, coaching, and luck. But the classification result is strong: the model identifies star-potential vs bust-risk profiles well above chance.